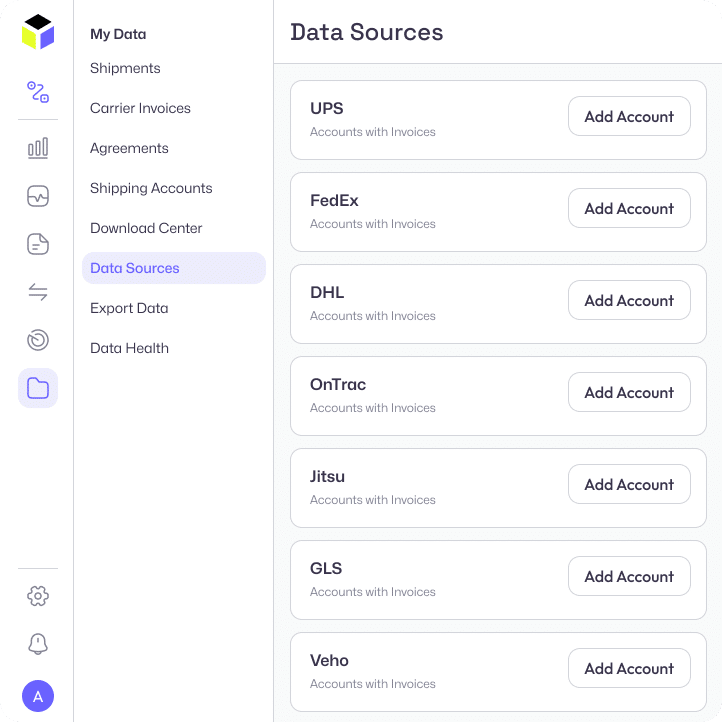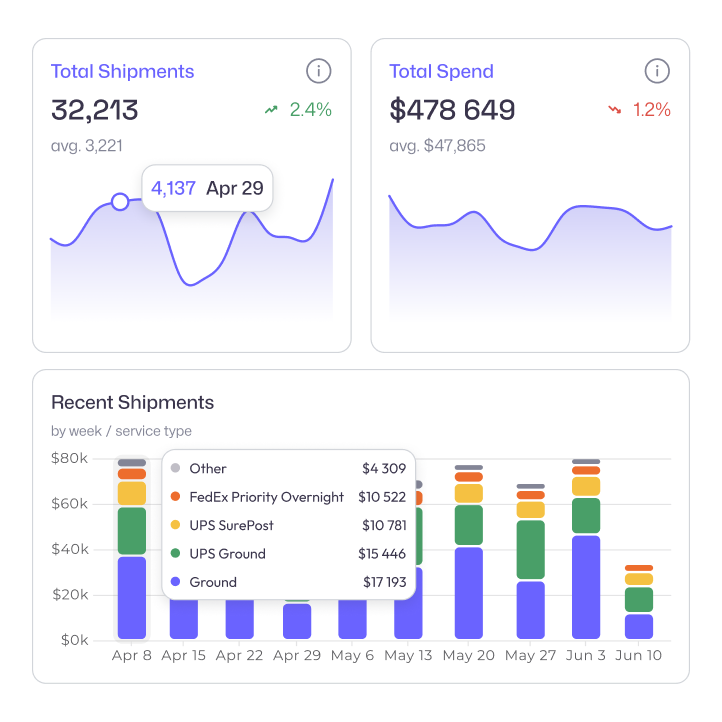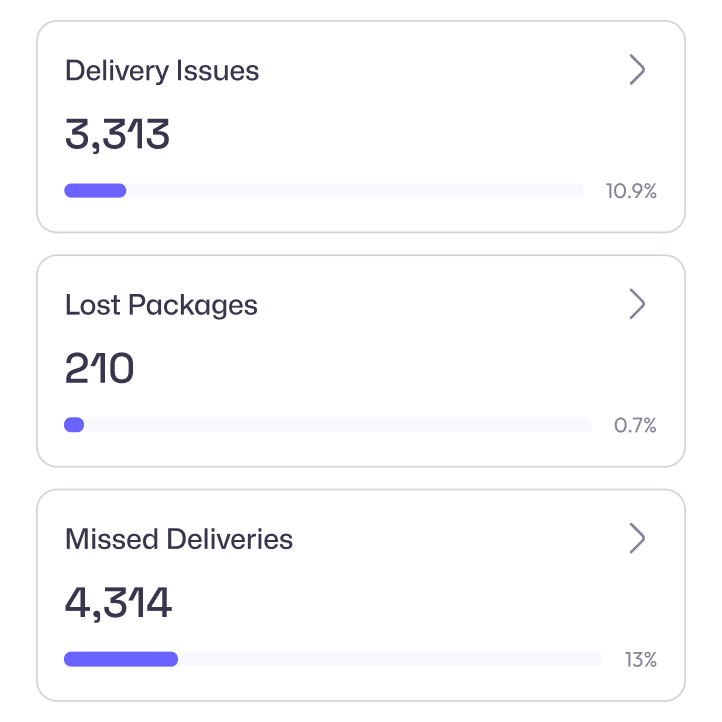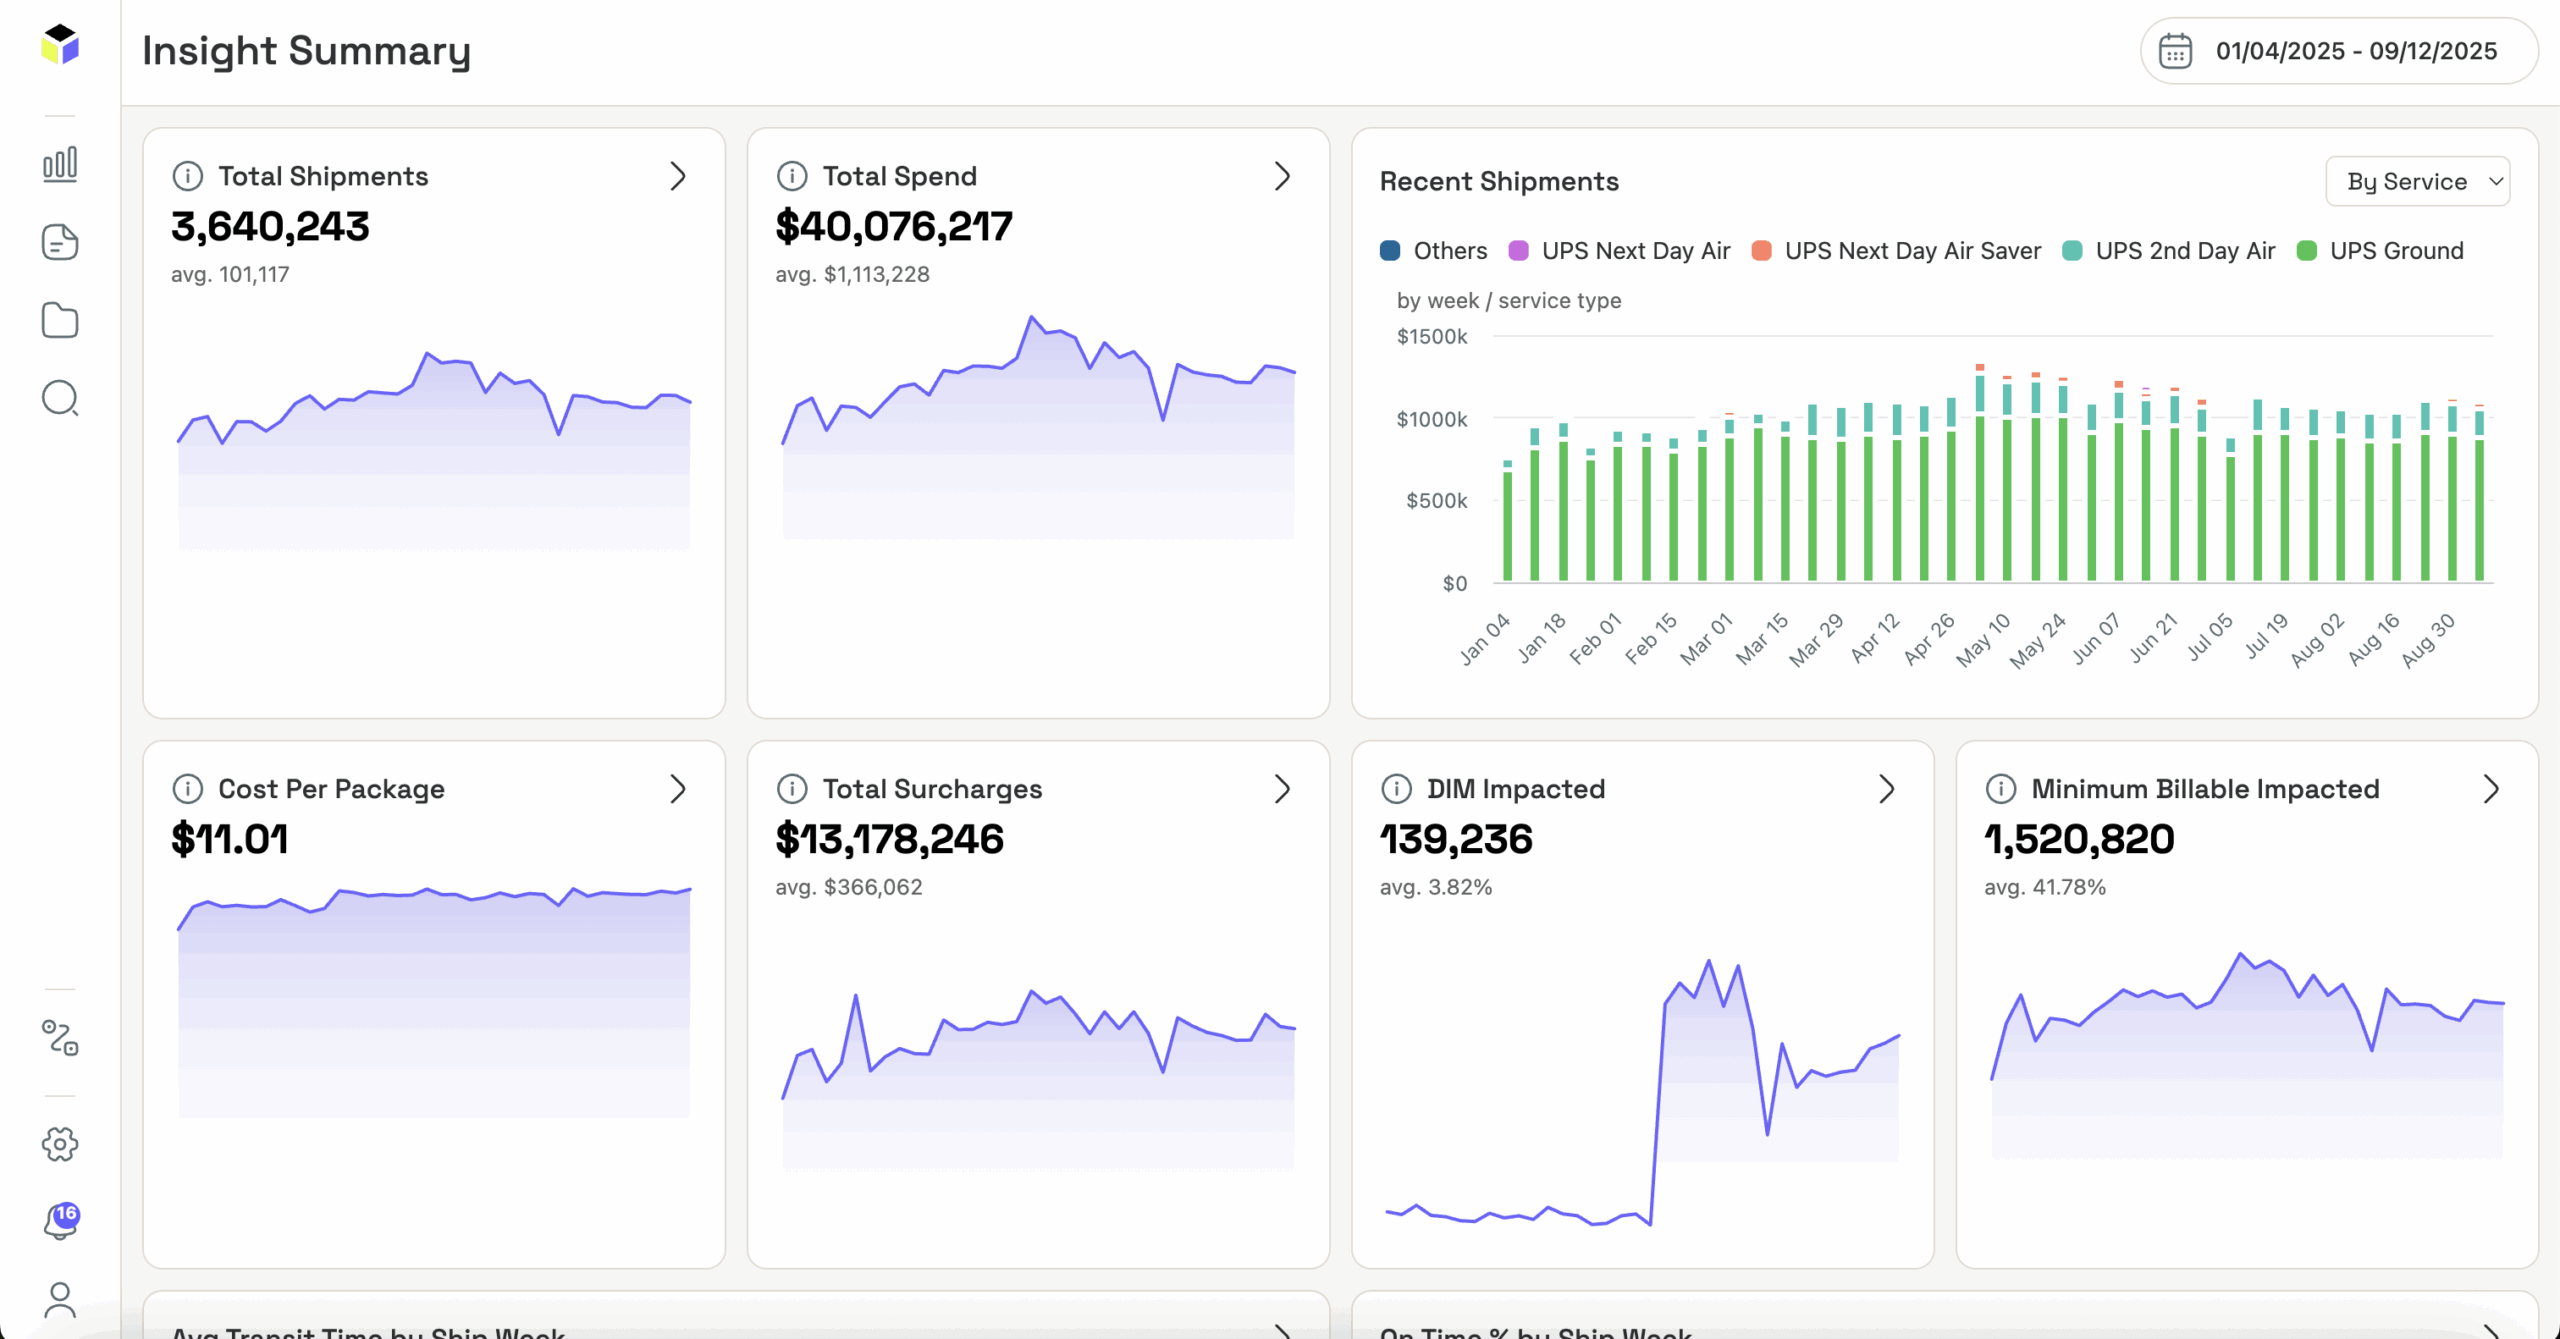
Gain a comprehensive view of all your carriers' performances through a single dashboard, eliminating the need to juggle multiple platforms.
This centralized approach simplifies your logistics operations, enhances decision-making, and ensures you maintain high performance standards across all shipping activities.
Recover money
SimpleClaimsAutomate loss & damage claims end to end ActiveAuditParcel audit & automated carrier disputesOptimize & monitor
CarrierWatchTime-in-transit & SLA monitoring My Next Carrier FREEFind new, alternative carriers from your data Parcel Data Platform FREECross-carrier data & unified reportingAutomate & build
ParcelAgents NEWAgentic AI layer for your parcel ops ShipScience APIBuild on our parcel data & toolingSimpleClaims ROI
What could you recover?
Estimate your loss and damage claims upside in two minutes.
Calculate your ROI →By industry
Apparel & Accessories Beauty & Supplements Furniture & Big-and-Bulky Subscription Boxes 3PLs & FulfillmentCustomer stories
See real results
How shippers cut costs and recovered more with ShipScience.
Read customer stories →Contracts & negotiation
Rate Negotiations FULL SERVICEOptimize and own your custom rates Bid Rating NEWScore a proposal before you sign Contract Pricing BlueprintWhat fair looks like, by the numbers Contract Negotiation BlueprintA data-built negotiation playbookRate-change impact
GRI Impact Analysis NEWYour real annual rate increase Peak / Demand ImpactWhat surcharges are costing you Announcement ImpactThe dollar cost of one change Rezone ImpactCost of an origin ZIP changeNetwork & flexible
Network Strategy FULL SERVICEDesign your optimal carrier network M&A / DiligenceParcel spend read before a deal Advisory & StrategyExpert time, $350/hr Custom ProjectScoped to your situationFree analysis
Not sure which engagement?
We model the opportunity on your real shipment data.
Get a free analysis →Learn
Guides NEWHow parcel pricing works Glossary NEWEvery shipping term, defined Carrier UpdatesLive rate & surcharge changesTools
Claims ROI CalculatorEstimate recoverable claims Audit ROI CalculatorEstimate refund upside API & Help DocsSetup and referenceSimpleClaims ROI
What could you recover?
Estimate your loss and damage claims upside in two minutes.
Calculate your ROI →Recover money
SimpleClaimsAutomate loss & damage claims end to end ActiveAuditParcel audit & automated carrier disputesOptimize & monitor
CarrierWatchTime-in-transit & SLA monitoring My Next Carrier FREEFind new, alternative carriers from your data Parcel Data Platform FREECross-carrier data & unified reportingAutomate & build
ParcelAgents NEWAgentic AI layer for your parcel ops ShipScience APIBuild on our parcel data & toolingSimpleClaims ROI
What could you recover?
Estimate your loss and damage claims upside in two minutes.
Calculate your ROI →By industry
Apparel & Accessories Beauty & Supplements Furniture & Big-and-Bulky Subscription Boxes 3PLs & FulfillmentCustomer stories
See real results
How shippers cut costs and recovered more with ShipScience.
Read customer stories →Contracts & negotiation
Rate Negotiations FULL SERVICEOptimize and own your custom rates Bid Rating NEWScore a proposal before you sign Contract Pricing BlueprintWhat fair looks like, by the numbers Contract Negotiation BlueprintA data-built negotiation playbookRate-change impact
GRI Impact Analysis NEWYour real annual rate increase Peak / Demand ImpactWhat surcharges are costing you Announcement ImpactThe dollar cost of one change Rezone ImpactCost of an origin ZIP changeNetwork & flexible
Network Strategy FULL SERVICEDesign your optimal carrier network M&A / DiligenceParcel spend read before a deal Advisory & StrategyExpert time, $350/hr Custom ProjectScoped to your situationFree analysis
Not sure which engagement?
We model the opportunity on your real shipment data.
Get a free analysis →Learn
Guides NEWHow parcel pricing works Glossary NEWEvery shipping term, defined Carrier UpdatesLive rate & surcharge changesTools
Claims ROI CalculatorEstimate recoverable claims Audit ROI CalculatorEstimate refund upside API & Help DocsSetup and referenceSimpleClaims ROI
What could you recover?
Estimate your loss and damage claims upside in two minutes.
Calculate your ROI →