


TL;DR: Spreadsheets persist in shipping operations because integrated platforms connect operational data but leave billing reconciliation in a separate universe. Carriers provide real-time tracking APIs but send billing data through manual downloads, EDI files, or email. At 10,000+ shipments weekly, this disconnection creates latency gaps, data integrity failures, and information asymmetry costing companies 2-8% of shipping spend. The problem is structural data connectivity, not workflow discipline.
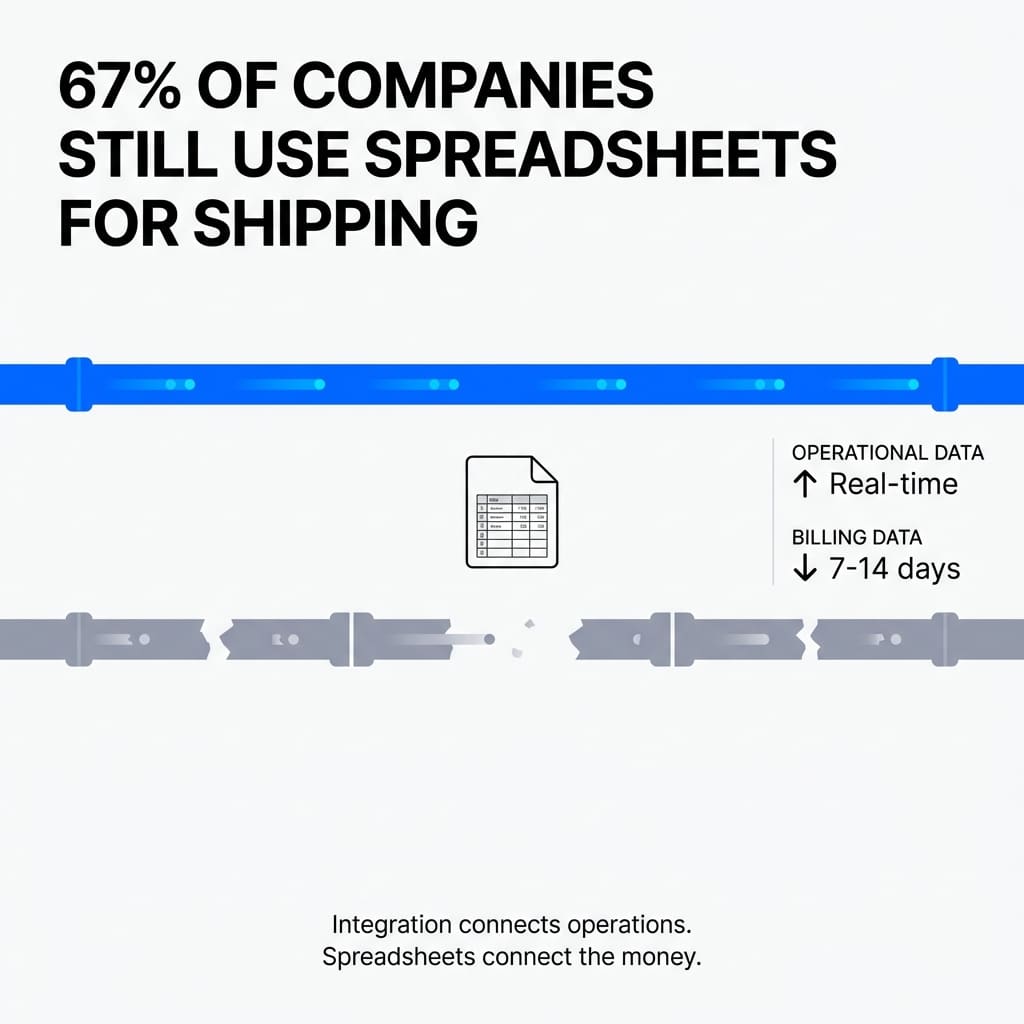
Two out of three companies use spreadsheets for supply chain operations. Organizations invest hundreds of thousands in integrated shipping platforms, connect modern APIs, deploy automation across fulfillment operations.
Then they export data to spreadsheets every single day.
The industry frames this as a training problem or an adoption issue. The pattern reveals something different. Spreadsheets persist because they solve a coordination problem that integration cannot address architecturally.
What Integration Actually Integrates
Integrated shipping platforms succeed at connecting operational systems. Label generation works. Carrier selection works. Tracking works. Delivery confirmation works. Organizations watch packages move from dock to doorstep in real time.
The financial reconciliation layer exists in a completely separate data universe.
Carriers provide real-time tracking APIs for operational visibility. Billing data arrives days or weeks later through manual downloads, EDI files, or spreadsheets via email.
The biggest carriers provide no APIs for package billing detail. They rely on manual downloads from billing centers. File transfers exist for the largest shippers only. Most alternative carriers send billing data over email or in spreadsheets.
When someone says integrated shipping stack, they mean integrated operational visibility with completely disconnected financial reconciliation.
The definitive record of what you paid and why arrives through different channels, in different formats, days after the operational event. Organizations reach for spreadsheets because the data arrives in spreadsheet format.
The Pattern: Integration connects operational data streams. Financial reconciliation remains structurally disconnected from that pipeline.
Why Low Volume Hides the Problem
Spreadsheets create an illusion of control. At low volume and low complexity, they work well enough to mask the structural problem underneath.
The pattern emerges around 10,000 shipments per week. Below threshold, spreadsheet coordination feels manageable. Someone exports carrier invoices, runs VLOOKUP formulas, spots discrepancies, files claims. Takes a few hours. Works fine.
Then volume scales.
The problem compounds along two dimensions. First, pure volume. 100,000 shipments per week is exponentially worse than 10,000. A million is exponentially worse than 100,000.
The second dimension matters more: network complexity.
Companies operating multiple brands, multiple distribution centers, multiple fulfillment channels using multiple carriers face geometrically more data sources requiring consolidation. Each additional carrier, brand, or DC multiplies the coordination burden.
What breaks first is not the spreadsheet itself. The data assembly process that feeds the spreadsheet collapses.
The Inflection Point: Spreadsheets work until 10,000 shipments weekly. After threshold, network complexity compounds faster than coordination capacity scales.
How Data Assembly Collapses at Scale
Organizations hit a latency threshold where insights arrive too late to matter. Coalescing data from multiple carriers, integrating it with order details, stitching it together for multiple brands takes a week to produce. Operating one week in arrears.
Always chasing insights that reflect last week's reality.
One customer experienced an internal operational shift that moved significant volume from one service to another due to flawed rate shop logic. They bled $5,000 daily in unnecessary costs without any time in transit benefit.
Because they operated one to two weeks in arrears, the problem cost $20,000 to $40,000 before detection.
Some organizations accept incomplete data rather than wait for complete data. They use signals from their primary carrier because integrating alternative carriers is too difficult. Trusting 70% of data represents 100% of reality.
Sometimes the assumption holds. Sometimes the remaining 30% behaves completely differently. Optimization decisions based on incomplete data make things worse.
The rational calculation organizations make: directional accuracy now beats perfect accuracy later.
When Spreadsheets Snowball
The progression from workaround to coordination failure follows a predictable path. Internal tools fall short of operational needs. Someone builds a spreadsheet as a temporary hack. The hack works well enough to become permanent.
More people start using the spreadsheet. Those people build their own spreadsheets. Those spreadsheets need to talk to each other.
The problem is not just proliferation. The latency involved with updating information across multiple sheets and the errors resulting from connecting multiple data sources using Excel tricks like VLOOKUP compound the failure.
Data cleanliness becomes a data integrity crisis. Spreadsheets become too large or corrupt from too much information. They become unusable. Organizations reset the entire process.
At this point, organizations are not managing shipping operations. They are managing spreadsheet infrastructure.
The Cascade: Latency in data assembly means organizations react to problems days or weeks after they occur. The cost is measured in thousands of dollars per day of delay.
Why Carrier Billing Data Resists Consolidation
Even when billing data arrives electronically, it arrives in carrier-specific formats. The data is not homogenized, translated, or organized for consolidation into a single data warehouse.
UPS uses a multi-line invoice file. One line per specific charge. When charge adjustments occur, UPS rebills against the package on a future invoice with a charge adjustment line.
FedEx bills one line per package. Adjustments get billed back to the original invoice retroactively.
This structural difference means answering a basic question like what did this shipment cost requires carrier-specific logic to reconstruct the true cost. Translation layers need to understand how each carrier structures charges, applies adjustments, handles corrections.
Rates and surcharges do not map from carrier to carrier. Comparing costs becomes an apples-to-oranges exercise where the fruit itself is defined differently by each vendor.
The Challenge: Each carrier defines billing logic differently. Comparing costs requires translation infrastructure that most organizations lack.
The Calculation Complexity Wall
Organizations underestimate the complexity of billing calculations when they attempt to build reconciliation capability in-house.
Base rates seem straightforward. Just apply a matrix. But surcharges calculate against different bases depending on context. Some apply to the base rate. Others factor against the retail rate. Some are static charges that matrix by zone.
Then you hit the complex variables. DIM divisors affect how dimensional weight factors into package pricing. Minimum billable amounts mean your effective discount differs from your actual discount on lightweight, short-zone packages.
Modeling this on a single carrier basis is convoluted. Modeling and comparing side-by-side across multiple carriers requires encoding carrier-specific procedural logic that changes with contract negotiations.
This complexity does not get solved by better integration or more API endpoints. It requires infrastructure that translates between incompatible data universes.
The Reality: Billing calculation complexity exceeds what most organizations expect when building in-house. The logic changes with every contract negotiation.
The Strategic Cost Nobody Measures
When organizations fall back to spreadsheets after in-house tools fail to keep pace with complexity, they measure latency and data integrity issues. The hidden cost is strategic.
Without understanding what drives costs and what influences them most, optimizing service and cost relationship becomes impossible.
This gets worse when you recognize that each carrier's rates and agreements are negotiable. Virtually every term is negotiable. Understanding rates, understanding which levers are available, understanding how hard to pull them, synthesizing the impact requires complex scenario modeling.
Most shippers lack the capability to perform that modeling.
This creates information asymmetry between shippers and carriers. Carriers have complete visibility into their pricing logic. They model scenarios perfectly. Shippers operate with incomplete reconstruction through spreadsheets.
That asymmetry has real financial impact. Manual auditing of parcel invoices in large volumes can lead to overpayments of up to 15%. Companies typically recover between 2-8% of their total shipping spend by identifying overcharges and duplicate billing errors.
The margin you're leaving on the table isn't just operational inefficiency. It's negotiation disadvantage compounded over time.
The Gap: Carriers model pricing perfectly. Shippers reconstruct it imperfectly. This asymmetry costs 2-8% of shipping spend in recoverable overcharges.
Why the Industry Misframes This
The industry frames this as a spreadsheet problem rather than recognizing it as a structural data connectivity problem because spreadsheets appear viable until you scale or unravel the complexity.
They work well enough at low volume. Organizations do not recognize the structural problem until they cross the threshold where spreadsheets become unsustainable. By that point, spreadsheets are deeply embedded in operations.
Organizations build up history in whatever system they create. There are operational costs associated with switching and figuring out how to migrate out of legacy business systems. You risk losing historical data that has become institutional knowledge.
The switching costs create lock-in. The historical data dependency creates deeper lock-in. Organizations become trapped by current workflow and by accumulated history that's difficult to migrate.
The Lock-In: Organizations become trapped by accumulated historical data that's difficult to migrate, not just by current workflow costs.
The Assumption That Needs to Die
The industry needs to stop treating billing data as an afterthought.
Shippers and carriers hyper-index on operational data. Time in transit, tracking details, progress from dock through delivery. The entire integrated shipping stack optimizes for operational visibility and speed.
The reconciliation of quoted cost versus actual cost, the breakdown of what went into charges on a package-level basis, the organization of cost data where the real definitive information about each shipment and its associated fees and surcharges lives. None of that is part of the equation for carriers or shippers out of the box.
This problem improves when shippers apply pressure to introduce universal package-level detailed information APIs. APIs that deliver billing data with the same real-time accessibility as tracking data.
Until that happens, the last mile of shipping automation continues requiring spreadsheets. Not because organizations lack discipline or training. Because the data connectivity infrastructure that would eliminate spreadsheets does not exist in the market yet.
The assumption that more integration solves coordination problems misunderstands what integration actually connects. Operational visibility is not operational control. Real control requires closing the loop between what you were quoted, what you were billed, and what you should have been charged.
That loop remains structurally open in most shipping operations. Spreadsheets are the visible symptom of the gap.
What This Means for Operations Above 10,000 Shipments Weekly
Operating above 10,000 shipments per week with multiple carriers, multiple brands, or multiple fulfillment channels means your spreadsheet usage is not a workflow problem. It's a data connectivity problem.
The question is not how do we eliminate spreadsheets. The question is what data connectivity infrastructure would make spreadsheets unnecessary.
That infrastructure needs to consolidate carrier-specific billing formats into universal schemas. It needs to translate between incompatible rate structures. It needs to encode carrier-specific procedural logic for calculating true costs. It needs to deliver that data with the same real-time accessibility as operational tracking data.
Organizations that build this capability in-house typically underestimate the complexity and maintenance burden. Calculation logic changes with every contract negotiation. Carrier formats change without notice. Edge cases multiply faster than core processes as volume scales.
The alternative is accepting that billing reconciliation lives in a separate operational universe from your integrated shipping stack. That acceptance means accepting the information asymmetry, the latency gap, the coordination costs, the margin leakage.
What assumptions about your shipping automation might not survive contact with scale?
Frequently Asked Questions
Why do companies still use spreadsheets despite having integrated shipping software?
Spreadsheets persist because integrated shipping platforms connect operational data (tracking, labels, delivery) but leave billing reconciliation in a separate universe. Carriers send billing data through manual downloads, EDI files, or email days after shipments, creating a structural gap that spreadsheets fill.
At what volume do spreadsheets become a problem for shipping operations?
The pattern emerges around 10,000 shipments per week. Below threshold, spreadsheet coordination works. Above threshold, network complexity (multiple carriers, brands, DCs) compounds faster than coordination capacity scales, causing data assembly processes to collapse.
What's the real cost of relying on spreadsheets for shipping reconciliation?
Manual auditing of parcel invoices leads to overpayments of up to 15%. Companies typically recover 2-8% of total shipping spend by identifying overcharges and duplicate billing. The hidden cost is information asymmetry with carriers during rate negotiations.
Why is carrier billing data so difficult to consolidate?
Each carrier uses different schemas and logic. UPS uses multi-line invoice files with future adjustments. FedEx uses single-line files with retroactive adjustments. Rates and surcharges follow carrier-specific calculation rules including DIM divisors, minimum billables, and zone-based matrices that vary by contract.
What infrastructure would eliminate the need for spreadsheets in shipping operations?
Infrastructure that consolidates carrier-specific billing formats into universal schemas, translates between incompatible rate structures, encodes carrier-specific procedural logic, and delivers billing data with the same real-time accessibility as operational tracking data.
How does spreadsheet dependency create negotiation disadvantages with carriers?
Carriers have complete visibility into their pricing logic and model scenarios perfectly. Shippers operating with incomplete reconstruction through spreadsheets face information asymmetry. Without ability to perform complex scenario modeling of rate changes, shippers negotiate from a position of reduced visibility.
What happens when spreadsheet workflows snowball out of control?
Internal tools fall short. Someone builds a temporary spreadsheet. More people use the spreadsheet. Those people build their own spreadsheets. Spreadsheets need to talk to each other. Latency increases. VLOOKUP errors multiply. Data integrity collapses. Spreadsheets corrupt from too much information. Organizations end up managing spreadsheet infrastructure instead of shipping operations.
Why do organizations accept incomplete data rather than waiting for complete data?
The rational calculation is directional accuracy now beats perfect accuracy later. Organizations use signals from their primary carrier (70% of volume) because integrating alternative carriers is difficult. Operating one to two weeks in arrears costs more than decisions based on incomplete data.
Key Takeaways
- Spreadsheets persist because integrated platforms connect operational data streams but leave financial reconciliation structurally disconnected. The problem is data connectivity architecture, not workflow discipline.
- The critical threshold is 10,000 shipments weekly. Network complexity (multiple carriers, brands, DCs) compounds super-linearly with volume, causing coordination failure that spreadsheets cannot solve at scale.
- Carrier billing data arrives through incompatible channels and schemas. UPS and FedEx use fundamentally different invoice structures. Calculation logic includes carrier-specific rules for DIM divisors, minimum billables, and zone matrices that change with each contract.
- Information asymmetry between shippers and carriers creates negotiation disadvantage. Carriers model pricing scenarios perfectly. Shippers reconstruct pricing logic imperfectly through spreadsheets. This gap costs companies 2-8% of shipping spend in recoverable overcharges.
- The data assembly process collapses before spreadsheets break. Latency gaps of one to two weeks mean organizations chase last week's insights. A $5,000 daily cost problem becomes a $20,000 to $40,000 problem before detection.
- Building billing reconciliation infrastructure in-house fails because organizations underestimate complexity. Calculation logic changes with every contract negotiation. Carrier formats change without notice. Edge cases multiply faster than core processes at volume.
- The industry needs to stop treating billing data as an afterthought. Real operational control requires closing the loop between quoted cost, billed cost, and correct cost. Operational visibility is not operational control.

")


