


Quick Summary: High-volume shippers using spreadsheets for claims management face structural coordination collapse after 10,000 weekly shipments. Manual data assembly creates permanent blind spots in recovery because coordination geometry scales faster than human capacity. The gap between organizations with connected data versus manual processes produces 10-20 percentage point differences in approval rates and millions in abandoned recoverable value annually.
The Inflection Point Nobody Sees Coming
At 1,000 shipments per week, claims management feels manageable. You're dealing with one to ten claims. Someone downloads the shipping report, pulls the order data, matches invoice values, and files claims before eligibility windows close.
At 10,000 shipments weekly, you're managing 10 to 50 claims. Coordination starts showing cracks.
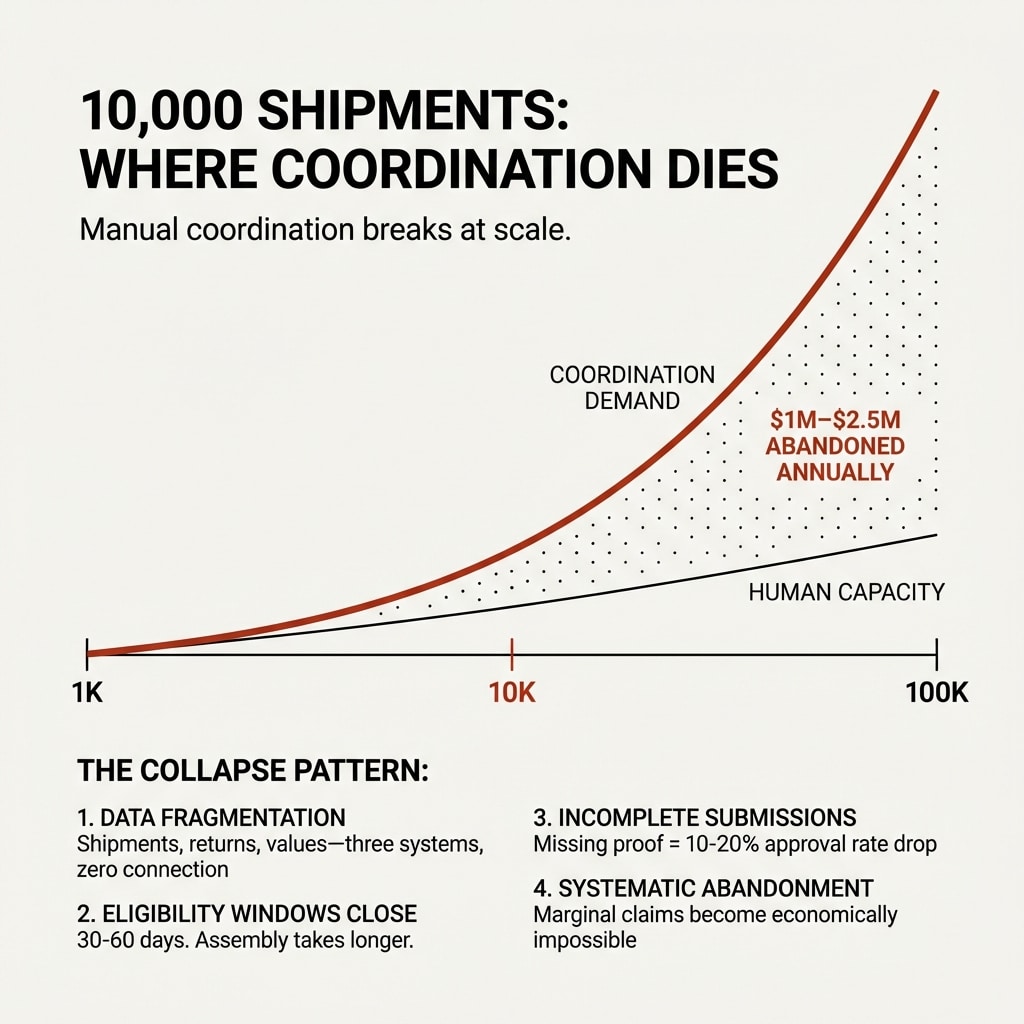
At 100,000 shipments per week, you're looking at 100 to 500 claims requiring assembly and justification. Manual coordination doesn't just get harder at this threshold. It becomes structurally impossible.
The pattern observed across dozens of organizations shows this isn't about effort or competence. It's about coordination geometry at scale.
Loss and damage occur at fractions of 1% of total shipments. The problem isn't the percentage. It's volume multiplication combined with carrier diversification and brand complexity.
Organizations managing claims across UPS, FedEx, USPS, and regional carriers, with multiple brands and third-party drop-shipping arrangements, encounter a coordination problem that spreadsheets cannot solve. Research shows 82% of enterprises report data silos disrupting critical workflows.
Shipping operations follow this exact pattern.
Why Coordination Collapses Follow Predictable Patterns
The collapse happens gradually. You don't notice the problem until it becomes pervasive.
It's the boiling frog effect. Efficiency erodes as departments and systems become less cohesive. There's no catastrophic failure point. Just systematic leakage that compounds as volume scales and complexity rises.
Here's what creates the pattern:
Customer service triggers claims when customers complain. Operations diagnoses failure modes. Finance collects payments. Three departments, three handoffs, zero ownership of results.
Shipment details live in one spreadsheet. Returns data sits in another. Product values exist in a third system. Invoice proof of value requires manual requests to accounting.
Every download introduces error opportunities. Every vlookup creates version control problems. Every save adds data corruption risk.
Claims eligibility windows expire in 30 to 60 days from shipment date. At enterprise scale, any inflection point occurring in real time gets buried under transaction volume accumulating since that inflection occurred.
Manual data assembly takes time. Teams wait for someone to send the correct spreadsheet while eligibility windows close on recoverable value.
Organizations shipping 50,000 boxes weekly lose $20,000 to $50,000 in eligible claims every week. Multiply across a year and you're looking at $1 million to $2.5 million in recoverable value evaporating.
The awareness gap exists because relative to total shipping spend of $600,000 to $1,000,000 per week, abandoned claims don't register as the primary problem. But aggregate economics justify infrastructure investment when you can see the full picture.
Disconnected data prevents organizations from seeing aggregate opportunity.
The Industry Misdiagnosis That Makes Things Worse
The shipping industry responded to claims problems with tools accelerating filing. File faster. Submit more claims. Batch process everything.
This treats symptoms, not causes.
The problem isn't filing friction. It's data disconnection and procedural incompleteness.
Most outsourced claims providers deflect all claims to their platform focusing on one objective: getting claims filed. They don't prioritize data completeness. They don't provide defensible proof of value documentation. They don't monitor marginal claims or macro trends across the claims ecosystem.
They're generating filing activity without understanding why claims perform the way they perform.
Here's what happens when you file claims with basic information but not complete information:
Carriers take one of two actions. They reject outright, or they contact you requesting more information.
At scale, responding to thousands of these requests becomes impossible. You don't have capacity to provide details for every marginal claim. Outsourced providers don't have connectivity to your business systems. They only possess enough information to get claims filed initially.
The pattern creates a downstream bottleneck. Filing incomplete claims shifts coordination failure from your team to the carrier's processing queue. Claims either sit in limbo, generate follow-up requests you can't answer, or get denied for missing documentation.
Your approval rate drops 10 to 20 percentage points compared to organizations with connected data infrastructure.
The gap isn't small. It's the difference between 90% approval rates and 70% approval rates on loss claims. On damage claims with proper setup, the difference between 60% approval and 40% approval.
Industry tools optimize for activity metrics like claims filed and tickets opened. They don't optimize for outcome metrics like payments received and reconciliations completed.
Upstream intervention requires less infrastructure investment and produces faster demonstration of activity. This creates a market full of partial solutions that look effective on surface examination but don't address root coordination pathology.
What Complete Information Actually Requires
Filing a claim with just a tracking number, generic description, and estimated value is easy. Getting that claim approved is a different problem.
Carriers need specific documentation to process claims and submit information to underwriters:
Proof of value on brand-specific invoices. If you operate multiple brands under one centralized shipping program, each brand requires separate proof of value documentation.
Proof of ownership. Brand information, ship-from location, bill-to details, payment information specifying where claims get paid.
Complete customer information. Ship-to address, phone numbers, contact details where the shipment was intended to go.
Merchandise descriptions. Physical documentation about what was in the box. Carriers actually attempt to locate lost packages. Vague descriptions like "clothing" don't help search processes. Specific descriptions like "men's blue cotton t-shirt size large" enable recovery attempts.
Field formatting compliance. All information needs proper formatting. Address information, phone numbers, brand details must match what carriers have on file. Mismatches trigger denials.
If any of these elements are missing or don't match carrier records, claims get denied or stuck in processing loops requiring manual intervention.
At 10,000 weekly shipments generating 10 to 50 claims, assembling this complete package manually for each claim becomes the bottleneck. At 100,000 weekly shipments generating 100 to 500 claims, manual assembly becomes structurally impossible.
The coordination requirement scales faster than linear growth. You're not just managing more claims. You're managing more claims across more carriers, more brands, more third-party arrangements, and more documentation sources that don't talk to each other.
Why Carriers Aren't The Enemy
The adversarial framing persists because getting everything right is genuinely difficult. You experience claim denials you believe were valid. Those claims probably were valid, but didn't follow exact protocols carriers need to approve claims.
Here's what gets missed in the adversarial framing:
Carriers aren't denying claims to protect margins. They're trying to process claims but encounter information gaps.
Incomplete claims create processing costs for carriers. Their teams triage submissions, send follow-up requests, wait for responses that often never come, then deny claims for procedural incompleteness.
Complete information reduces carrier processing costs by eliminating triage requirements and follow-up loops. Better input quality makes their processes more efficient while improving your recovery rates.
This creates alignment opportunity that adversarial positioning prevents you from recognizing.
When you submit claims with complete documentation, proper formatting, and all required proof elements, carriers can process them efficiently. Your approval rates improve. Their processing costs decrease. Both parties benefit from better data connectivity.
The structural reality is that carriers benefit from reduced garbage-claim volume just as much as you benefit from higher approval rates on legitimate claims.
How Loss Claims Reveal Process Completeness
Claims bucket into two categories. Loss claims where packages never delivered and carriers have no proof of delivery. Damage claims where packages arrived damaged.
Damage claims are wildly diverse. Success rates depend on packaging quality, materials, handling characteristics, and product fragility. Benchmarking across organizations is difficult because variables differ significantly.
Loss claims are definitive.
When you do everything correctly, loss claims should get accepted at very high rates. When data assembly is done correctly, loss claims get approved at higher than 80% on average. In many cases, higher than 90%.
The gap between those numbers and what most organizations achieve traces to proper setup and completeness.
Organizations with almost all claims denied often have multiple brands or drop-shipping arrangements without appropriate third-party shipment claim setup with carriers. Without proper configuration, claims get systematically denied regardless of validity.
In most cases, the problem is simpler. Missing proof of value documentation. Incomplete contact information. Vague merchandise descriptions that don't help carriers during search processes.
These aren't complicated problems. They're coordination problems that become impossible to solve manually at scale.
Loss claims serve as a litmus test for whether foundational coordination infrastructure exists. If your loss claim approval rate sits below 80%, you have a data assembly problem, not a carrier relationship problem.
The Permanent Blind Spots Spreadsheets Create
Spreadsheets signal the coordination problem. Data in spreadsheets ages from the moment you save. It's static, disconnected, and at scale that disconnection costs real money.
Here's what becomes invisible when shipping data lives in spreadsheets:
Claims volume monitoring at sufficient granularity. You don't know how many eligible claims exist across all carriers, brands, and timeframes. You only see claims that get filed, not claims that should have been filed.
Approval rate patterns by carrier, service type, and claim category. Without systematic tracking, you can't identify whether UPS approves claims at different rates than FedEx, or whether ground shipments have different loss patterns than air shipments.
Eligibility window expiration tracking. You don't see how many claims expire before filing because nobody assembled the required documentation in time.
Documentation completeness gaps. You can't identify which proof elements are consistently missing or which brands lack proper third-party claim setup.
Recovery value by time period and business unit. You don't know whether Q4 peak season creates different claim patterns than Q1, or whether specific distribution centers have higher loss rates indicating operational issues.
These blind spots aren't small. They represent the difference between systematic value recovery and systematic value abandonment.
Organizations don't realize they're losing $20,000 to $50,000 weekly because they can't see what they're not recovering. The data isn't centralized. Pattern recognition becomes impossible.
What Connected Data Infrastructure Actually Unlocks
Solving the data assembly problem doesn't just fix claims. It unlocks multiple optimization opportunities that were always present but invisible.
Claims recovery becomes nearly autonomous. When billing data, order management systems, tracking data, and label generation systems connect, you can assemble complete documentation automatically. Claims go through with full information and don't get stuck in carrier processing.
When claims do get stuck, connected systems monitor for those events and fill in requested information to push them through without manual intervention.
Real-time operational auditing becomes possible. You identify changes in parcel operations or billing behavior requiring immediate attention. Anomaly detection catches cost overruns before they compound.
You flag issues like packaging changes that weren't reflected in label generation systems, creating dimension mismatch charges. Or service level changes at the dock because something was behind schedule and somebody decided to speed up shipments without re-rating for optimized costs.
Network optimization becomes accessible. You re-rate existing volume and identify opportunities to push shipments to alternative carriers accepting your specific parcel profile at significant discounts without impairing transit times.
Regional carriers in the northeast or between LA and Northern California often provide cheaper and faster delivery options than national carriers for specific lanes. But you can't identify these opportunities without granular geographic analysis.
Rate change impact analysis becomes automatic. When UPS or FedEx announces changes to surcharge calculations or peak pricing, you understand cost structure impact immediately and introduce those topics to carrier reps for negotiation before overruns materialize.
These aren't separate problems requiring separate solutions. They're all downstream applications of the same data connectivity infrastructure.
The shipping industry has always sold these as independent services. Parcel audit was its own service. Claims were a cousin service, an ad hoc add-on. Contract management and network strategy were never productized.
Organizations treat them as independent when they all rely on the same foundational data layer.
Why Infrastructure Investment Changes The Economics
The reason organizations accept systematic value abandonment is that per-unit recovery economics look prohibitive while aggregate economics justify infrastructure investment.
When you're managing claims manually, each claim requires time to assemble documentation, verify information, format submissions, and follow up on carrier requests. At $50 to $100 in labor cost per claim, recovering $75 in claim value doesn't make economic sense.
So you rationally decide not to pursue marginal claims. You focus on high-value claims where recovery justifies effort.
This logic breaks down at scale.
Infrastructure investment amortizes coordination cost across entire transaction volume. When you build systems that automatically assemble documentation, verify completeness, and monitor claim status, the marginal cost per claim approaches zero.
Now recovering that $75 claim makes perfect economic sense. Multiply across thousands of claims and you're recovering millions in value that was previously abandoned as operationally impractical.
The strategic decision becomes clear. You either build infrastructure that transforms per-unit economics from prohibitive to profitable, or you accept permanent value leakage as operational exhaust.
Organizations choosing infrastructure investment recover 10 to 20 percentage points more in approval rates. They identify operational inefficiencies creating cost overruns. They optimize network strategy based on actual performance data rather than assumptions.
Organizations choosing manual processes watch $1 million to $2.5 million annually disappear into eligibility windows while teams wait for someone to send the correct spreadsheet.
The First Step Out Of Coordination Collapse
Breaking the coordination collapse pattern starts with connecting core data streams.
You need to connect billing data from carriers, order management systems containing customer and product information, tracking data showing delivery outcomes, and label generation systems capturing shipment characteristics.
These four data sources contain everything required to assemble complete claim documentation, identify operational anomalies, analyze network performance, and model rate change impacts.
Consolidating at the middleware level and feeding into your reporting systems creates visibility that didn't exist when data lived in disconnected spreadsheets.
This isn't a claims solution. It's infrastructure that makes claims recovery possible as the first application, then enables additional optimizations as you build on the same foundation.
The question isn't whether your shipping data contains recoverable value. It does.
The question is whether you're building infrastructure to extract it, or whether you're content watching coordination geometry make systematic recovery structurally impossible as volume scales.
Key Takeaways
- Manual coordination collapses at 10,000+ weekly shipments due to volume multiplication combined with carrier diversification and brand complexity, making per-claim assembly structurally impossible regardless of resource allocation
- Organizations shipping 50,000+ boxes weekly systematically abandon $1M-$2.5M annually in recoverable value because shipping data lives disconnected across spreadsheets and departments
- Accelerating claim filing without addressing data assembly creates 10-20 percentage point approval rate gaps by generating incomplete submissions that carriers deny or leave stuck in processing loops
- Loss claims serve as process litmus test because proper data assembly should yield 80-90%+ approval rates, revealing whether foundational coordination infrastructure exists
- Carriers benefit from complete information submissions that reduce their processing costs, but adversarial framing prevents recognition of this alignment opportunity
- Connected data infrastructure built for claims recovery simultaneously unlocks real-time auditing, network optimization, and rate impact analysis because all share the same foundational requirement
- Infrastructure investment amortizes coordination cost across transaction volume, transforming per-unit economics from prohibitive to profitable at scale
What operational pattern are you observing in your claims management that you haven't been able to quantify yet?


