


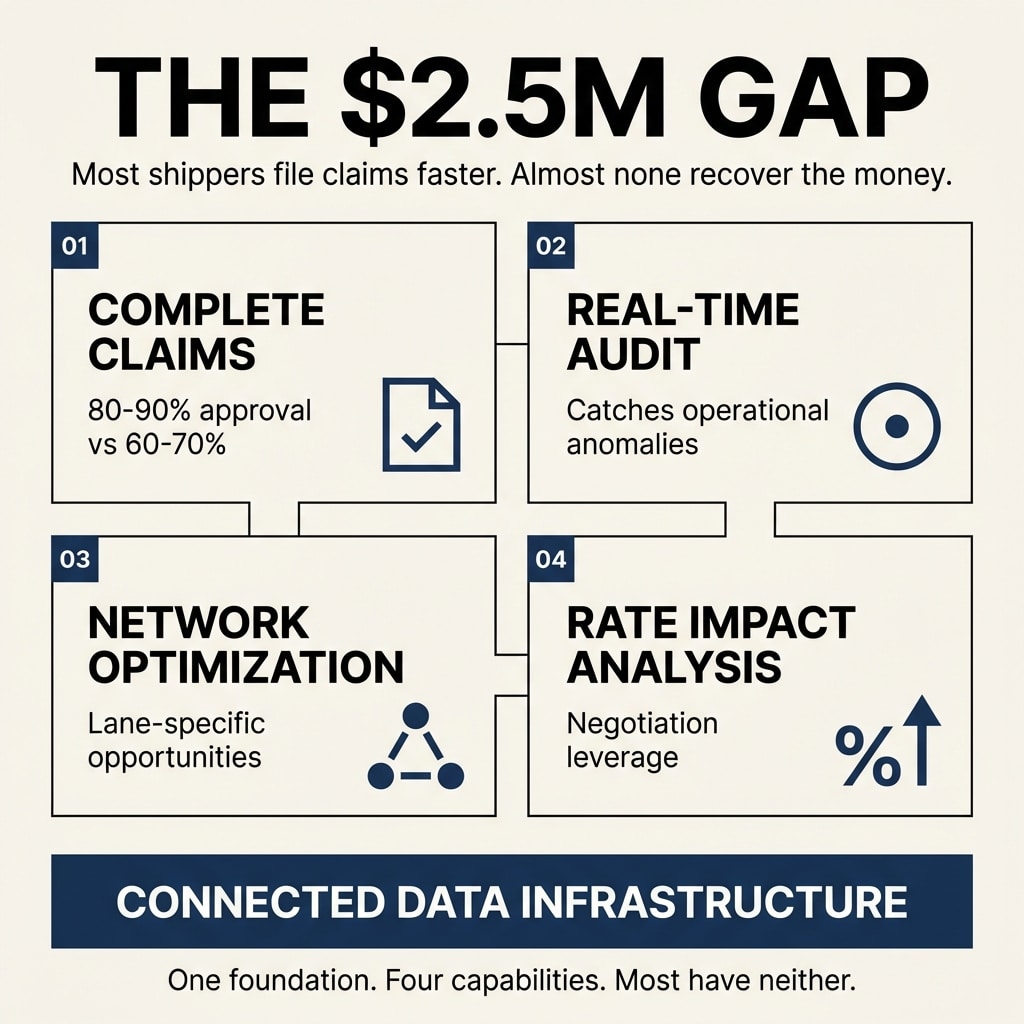
TL;DR: Organizations have tools for filing claims faster. Almost none have connected infrastructure for the four capabilities that recover value: claims with complete documentation, real-time carrier auditing, network optimization with current data, and rate impact analysis across the full shipment picture. The gap costs high-volume shippers $1M to $2.5M annually.
- Claims recovery requires complete data assembly before filing. Incomplete submissions create 10 to 20 percentage point approval rate gaps.
- Real-time auditing catches operational anomalies like packaging changes, service level shifts, and consolidation errors that traditional SLA monitoring misses entirely.
- Network optimization needs granular geographic analysis by DC and lane to reveal regional carrier opportunities invisible in aggregate data.
- Rate impact analysis transforms carrier pricing changes from cost overruns into negotiation leverage when data connectivity exists.
Why Most Recovery Tools Fail
The shipping industry sells claims filing tools. Submit faster. Batch process everything. Generate activity metrics.
This pattern plays out across dozens of organizations. They adopt these tools expecting recovery improvements. What they get is more claims filed with worse approval rates.
The problem isn't filing friction. It's data disconnection.
When organizations file a claim with a tracking number, generic description, and estimated value, carriers take one of three actions. They sit on it. They request more information. They deny it outright.
All three outcomes require manual intervention to unblock. At scale, responding to thousands of these requests becomes structurally impossible. Organizations generate filing activity without understanding why claims perform the way they perform.
The Pattern: The field optimizes for visible activity (claims filed, tickets opened) rather than ultimate outcomes (payments received, reconciliations completed). Upstream intervention requires less infrastructure investment and produces faster demonstration of activity.
What Complete Documentation Requires
Complete claims documentation isn't complicated. It's comprehensive.
Organizations need proof of value on brand-specific invoices. Proof of ownership showing brand details, ship-from location, and bill-to information. Payment details for where the claim gets paid. Customer information showing intended destination. Merchandise details describing what was in the box.
The physical documentation includes proof of purchase for the shipment and proof of value for contents.
All of this needs to match what carriers have on file. Field formatting requirements matter. Address completeness matters. Phone numbers matter. Brand details matter.
When any element is missing or doesn't match, carriers deny the claim. Not because they're protecting margins. Because they're trying to process claims but encounter information gaps they're unable to resolve.
At 10,000 weekly shipments, assembling this documentation manually for 10 to 50 claims becomes difficult. At 100,000 weekly shipments with 100 to 500 claims, manual assembly collapses completely.
This is where the coordination geometry problem manifests. Organizations aren't dealing with simple volume multiplication. They're managing claims across multiple carriers, multiple brands, and multiple third-party arrangements.
The Data: 75% of parcel audit credits owed by UPS and FedEx go unclaimed annually because coordination cost exceeds per-unit recovery value, even though aggregate economics justify infrastructure investment.
How Real-Time Auditing Differs From Legacy Approaches
Traditional parcel auditing looks for service level violations. Late shipments missing SLA. Voided labels that got billed. Invalid charges like address correction fees on correct addresses or residential surcharges on commercial deliveries.
Legacy audit also includes rate validation comparing carrier contracts to bills, and basic validity checking for duplicate charges.
These audits catch carrier billing errors. But carriers bill pretty accurately these days. Systematic billing errors are fairly infrequent.
What happens more commonly is operational changes that create cost overruns.
Packaging changes at the dock without updating label generation systems. Result: rebuild charges because dimensions don't match what's in the system.
Service level changes when something runs behind schedule and someone decides to speed up a shipment. Result: costs exceed what the rate shopping engine planned for.
Consolidation decisions where two orders going to the same location get bulk packed into one box without re-rate shopping. Result: the shipment gets rated for a service not optimized for those new dimensions and weights.
Real-time auditing uses machine learning to detect when events or data elements appear abnormal relative to historical trends. The system automatically sets tolerances that organizations adjust.
Custom audit rules monitor how shipping operations perform versus catching carrier billing issues. When operational anomalies trigger audit findings, the system assembles evidence packs presenting information clearly for carrier rep disputes.
The Reality: Human decisions at the dock level (packaging changes, service upgrades, consolidation without re-rating) create cost bleeding that traditional SLA monitoring never detects because these aren't billing errors. They're operational efficiency gaps.
Why Geographic Granularity Reveals Hidden Optimization
Aggregate data shows the forest. Geographic granularity shows the trees.
When organizations are multi-DC companies optimizing overall shipping volume without looking DC-to-DC, they miss something or make things more expensive relative to servicing shipments from specific distribution centers.
Sometimes it relates to product types serviced from particular DCs. Sometimes it's about lanes served by specific carriers. Sometimes alternative carriers serve a lane better than national carriers.
This pattern appears in the northeast. Between LA and northern California. Between Vegas and California where alternative carriers now have cheaper and faster delivery options than what UPS or FedEx offer.
Organizations need to look at lanes by volume to identify where the most impact occurs. But when they look by geography, they typically uncover trends that don't exist at the macro level.
The same applies to claims and other operational features. Organizations identify that certain failure modes occur more heavily within certain lanes or from certain DCs.
This leads to operational issues. Different labeling practices. Different packing practices. Things that ultimately cost organizations in delivery loss or damage in transit.
Organizations triage and fix these issues when they're looking at data at the DC level or geography level. Looking at the macro level buries these patterns under aggregate performance that appears acceptable.
The Discovery: Regional carriers often outperform nationals in specific geographic corridors, but these opportunities remain invisible in aggregate transit time analysis that masks lane-specific performance variations.
What Rate Impact Analysis Enables
When UPS or FedEx announces changes to surcharge calculations or peak pricing, most organizations react after costs materialize.
Connected data infrastructure lets organizations understand cost structure impact immediately. They model the changes against their actual shipping profile. They quantify exposure before it hits their invoice.
This transforms rate changes from cost overruns into negotiation leverage.
Organizations bring specific data to carrier reps showing exactly how changes affect their volume. They're not guessing. They're not estimating. They're presenting evidence.
The conversation shifts from accepting announced rates to negotiating exceptions based on profile characteristics.
But this only works when organizations scenario model in real time. When shipping data lives in disconnected spreadsheets, by the time they assemble analysis the implementation window has closed.
The Leverage: Businesses negotiating contracts with carriers save 10 to 30% compared to retail rates, but negotiation leverage requires data connectivity infrastructure that most organizations lack.
Why These Aren't Four Separate Problems
The industry has sold these as independent services. Parcel audit was its own thing. Claims were a cousin service, an ad hoc add-on. Contract management and network strategy were never productized.
So shippers treat them as independent problems requiring separate solutions.
They're not.
They're all downstream applications of the same data connectivity infrastructure. Once organizations solve data assembly for claims, they've solved it for auditing. Once they've connected billing data, order management systems, tracking data, and label generation systems, all four capabilities emerge naturally.
Claims become the proof case. The same infrastructure that assembles complete documentation for claims enables real-time anomaly detection for auditing. The same connected data streams that support claims recovery enable network optimization scenario modeling. The same data foundation that powers auditing enables rate impact analysis.
Organizations don't see this pattern because they're buying point solutions. Each vendor sells one piece. Nobody owns the infrastructure layer that enables all four.
ShipScience spends time on the front end connecting data sources. We gather information about brands, shipping profiles, and operational patterns. Setup details get completed so claims go through with full information.
When claims get stuck, the system monitors for those events and fills in requested information to push them through. But that's the first application.
The same infrastructure enables active auditing with custom rules for operational efficiency. It enables network optimization through carrier mixing analysis. It enables automatic rate change impact modeling for negotiation preparation.
The Infrastructure: Data connectivity built for claims recovery simultaneously enables auditing, network optimization, and rate analysis because all share the same foundational requirement: connected, complete, real-time data streams across billing, orders, tracking, and labels.
Where Organizations Get Stuck
The coordination collapse pattern is sneaky.
Organizations don't realize they have this problem until it becomes pervasive. There's no catastrophic fail point. Things get less efficient over time as leakage increases due to lack of cohesiveness between departments and across systems.
The combination of issues gets worse as volume scales and complexity rises.
At 1,000 shipments per week, managing claims manually is difficult but possible. At 10,000 shipments weekly, coordination starts breaking. At 100,000 shipments per week, manual coordination collapses completely.
This isn't about effort. It's about coordination geometry at scale making manual assembly structurally impossible regardless of resource allocation.
Organizations shipping 50,000 boxes weekly lose $20,000 to $50,000 in eligible claims every week. Multiply across a year and organizations are looking at $1 million to $2.5 million in recoverable value evaporating.
They're not losing it from incompetence. They're losing it because they don't realize they're losing it. The data isn't centralized. Claims volume monitoring doesn't exist at sufficient granularity to reveal what's missing.
The Threshold: At 10,000+ weekly shipments, coordination complexity compounds faster than linear scaling. The problem intensifies with success, making growth into the solution impossible without infrastructure that scales autonomously with volume.
What The First Step Looks Like
Start by connecting systems. Parcel billing data. Order management systems. Tracking data. Label generation systems.
Connect all of those things together as a starting point. That gets pretty good cohesiveness.
Feed that information centrally into whatever master reporting system is being used. Tableau, Looker, whatever. Consolidate at the middleware level and then feed into reporting systems for visibility and executive reporting packages.
This isn't about buying more tools. It's about building infrastructure that makes the tools organizations have work.
Once data connectivity exists, claims recovery becomes nearly autonomous. Real-time auditing becomes possible. Network optimization becomes accessible. Rate impact analysis becomes automatic.
These capabilities were present in shipping data. Organizations couldn't access them because the data lived disconnected across spreadsheets and departments.
The question isn't whether shipping data contains value. It does. The question is whether organizations are building infrastructure to extract it, or whether they're content watching recoverable millions disappear into eligibility windows while teams wait for someone to send the correct spreadsheet.
Common Questions About Recovery Infrastructure
What's the approval rate gap between complete and incomplete claims?
Organizations with connected data infrastructure that assembles complete documentation before filing achieve 80 to 90%+ approval rates on loss claims. Organizations filing with basic information typically see 60 to 70% approval rates. The 10 to 20 percentage point gap traces directly to data completeness, not claim validity.
How does real-time auditing catch problems traditional audit misses?
Traditional audit focuses on carrier billing errors (late shipments, invalid charges, rate mismatches). Real-time auditing uses machine learning to detect operational anomalies like packaging changes without system updates, service level upgrades without re-rating, or consolidation decisions that create cost overruns. These operational issues occur more frequently than billing errors.
Why does geographic granularity matter for network optimization?
Aggregate data masks lane-specific performance variations. Regional carriers often outperform nationals in specific corridors (northeast, LA to northern California, Vegas to California) but these opportunities disappear in macro-level analysis. DC-specific and lane-specific data reveals optimization opportunities impossible to see in aggregate.
What makes rate impact analysis effective for negotiation?
Connected data lets organizations model carrier pricing changes against their actual shipping profile before costs materialize. They quantify exposure with specific evidence rather than estimates. This transforms rate announcements from accepted cost increases into negotiation opportunities with documented leverage.
Why do these four capabilities require the same infrastructure?
Claims recovery, real-time auditing, network optimization, and rate impact analysis all depend on connected data streams across billing, orders, tracking, and labels. Once organizations solve data connectivity for one capability, the infrastructure enables all four simultaneously. The industry sells them separately, but they're downstream applications of the same foundational data layer.
At what volume does manual coordination collapse?
Coordination becomes difficult at 10,000 weekly shipments and collapses completely at 100,000 weekly shipments. This isn't about effort or resources. Volume multiplication combined with carrier diversification and brand complexity creates coordination geometry that makes manual assembly structurally impossible at scale.
What's the financial impact of data disconnection?
Organizations shipping 50,000+ boxes weekly systematically abandon $20K to $50K in eligible claims every week due to data disconnection. Annually, this represents $1M to $2.5M in recoverable value evaporating because coordination cost exceeds per-unit recovery economics, even though aggregate economics justify infrastructure investment.
How do carriers respond to complete versus incomplete claims?
Carriers attempt to process all claims but require complete information for approval. When claims arrive with incomplete data, carriers sit on them, request more information, or deny them outright. All three outcomes require manual follow-up. Complete documentation reduces carrier processing costs while improving shipper recovery rates because information gaps get resolved before submission.
Key Takeaways
- Claims recovery requires complete data assembly before filing. Incomplete submissions create 10 to 20 percentage point approval rate gaps regardless of filing speed or volume.
- Real-time auditing catches operational anomalies (packaging changes, service upgrades, consolidation errors) that traditional SLA monitoring misses because these aren't billing errors but operational efficiency gaps.
- Geographic granularity reveals lane-specific optimization opportunities invisible in aggregate data, particularly for regional carriers outperforming nationals in specific corridors.
- Rate impact analysis transforms carrier pricing changes into negotiation leverage when data connectivity enables real-time scenario modeling against actual shipping profiles.
- These four capabilities aren't separate problems. They're downstream applications of the same data connectivity infrastructure across billing, orders, tracking, and labels.
- Manual coordination collapses at 10,000+ weekly shipments due to volume multiplication combined with carrier diversification and brand complexity, making infrastructure investment essential.
- Organizations shipping 50,000+ boxes weekly abandon $1M to $2.5M annually in recoverable value because data disconnection makes per-unit coordination cost exceed recovery economics despite profitable aggregate opportunity.
What coordination pattern are organizations observing in their shipping operations that they haven't quantified yet?


")


