


Most enterprise parcel operations measure claims backwards.
They count claims filed. They track submission speed. They celebrate when the team processes more claims this quarter than last quarter.
The problem is none of those metrics tell you whether you're actually recovering money.
I've spent seven years inside parcel data streams across 502 enterprise accounts. What I've learned is that filing speed doesn't correlate with recovery, volume metrics hide abandonment, and the gap between "claims filed" and "claims paid" represents millions of dollars sitting in carrier queues that finance teams can't see.
Across 74.5 million shipments and 256,988 loss claims, the data shows something striking: enterprises file claims on 1-2% of shipments, but bottom-quartile accounts abandon 41.1% of what they file. That's not a process problem. That's a measurement problem.
When you measure claims as a revenue line instead of a cost center, the entire conversation with finance changes.
The Revenue Blindness Problem
Here's what actually happens on the P&L when a carrier pays a claim.
The money doesn't reduce freight expense. It arrives as a carrier credit or gets recognized as other income. The shipment cost what it cost. This is cash coming in that wasn't coming in before.
That distinction matters because cost reduction has a ceiling — you can only reduce spend to zero — but a revenue line has a budget, a forecast, and a variance report.
The moment you put claim recovery in the income statement rather than netting it against freight costs, it becomes something a CFO is accountable to.
Across 14 large-shipper accounts on ShipScience in 2025, monthly claim recovery has been positive in 99% of account-months. The floor month across the network was $137K. The ceiling was $805K. Per account, the median monthly run rate is $23,900, annualizing to $287K.
A CFO can put $250K–$350K per account per year in the budget with reasonable confidence. That's what a revenue line looks like — it has a floor, a range, and a story when it deviates.
The ratio that reframes the conversation: claim recovery averages 0.76–0.95% of shipping spend. For a company spending $30M per year on freight — roughly what a 150,000-shipment-per-month shipper spends — that's $230K to $285K per year in claim recovery.
That's not a rounding error. It's a line item that belongs in the annual budget conversation alongside freight rate negotiations and carrier contract renewals.
Research shows that revenue leakage costs logistics companies 3-15% of annual revenue, with 1-5% of EBITDA lost to inefficiencies and billing errors. Manual processes in invoice processing, reconciliation, and freight auditing are the primary culprits.
What the 74.5 Million Shipments Actually Show
The 74.5 million figure is the exact count of distinct tracking numbers for 417 accounts that have both shipment records and loss claims on the platform, measured from each account's onboarding date forward.
It's not an estimate. It's a row count.
The 3.45 loss claims per 1,000 shipments comes directly from dividing 256,988 loss claims by 74,510,494 shipments — both post-onboarding, both filtered to accounts with data in both tables.
That rate is the foundation for every downstream calculation about what's actually recoverable.
For a company shipping 100,000 packages per month, here's what the math looks like:
- 100,000 shipments/month × 3.45/1,000 = 345 loss claims filed per month
- 345 × 41.1% unresolved rate (bottom-quartile accounts) = 142 claims abandoned per month
- 142 × 39.5% win rate among resolved claims (bottom-quartile) = 56 claims per month that would have paid if closed
- 56 × $108 average payout per won claim = $6,052/month
- $6,052 × 12 = $72,621 per year
That $72K is the cost of abandonment specifically — claims filed and not closed.
It doesn't include the separate question of claims never filed in the first place, which is larger but harder to measure precisely because you'd need to know the true loss event rate, not just the filing rate.
The 3.45 per 1,000 figure is the observed filing rate on ShipScience, which is already higher than what most customers were filing before onboarding. So the $72K is a floor on the opportunity, not a ceiling.
The Abandonment Gap Nobody Measures
88% of bottom-quartile abandoned claims have a claim number but no carrier status — ever.
The carrier accepted the claim, issued a reference number, and then went silent. The system checked back for an average of 3.1 days, made 5.3 attempts, got no response, and stopped.
Those claims are now sitting dormant for an average of 548 days.
They weren't denied. They weren't paid. They simply exist in a state where neither side took another action.
The structural reason is that the system and the carrier are operating on incompatible response loops, and no one owns the gap between them.
Bottom-quartile abandoned claims were filed an average of 61 days after shipment — outside the optimal 8–45 day window. When you cross this against carrier timing patterns, FedEx makes up 96% of these abandoned claims, and FedEx's adjudication process for claims filed late appears to stall rather than formally deny.
The carrier doesn't reject the claim. It acknowledges it, issues a number, and then parks it in a queue that never moves.
There's no explicit denial the system can detect and respond to. There's just silence.
The actual coordination failure is this: claim filing and initial follow-up is automated. But when the carrier goes silent — specifically on FedEx claims filed after the optimal window — there is no escalation path that treats "no response after 5 attempts" as a signal requiring a different action.
The system interprets silence as pending and eventually stops checking.
What it should do is flag those claims as requiring a different intervention: resubmission through a different channel, a carrier account rep contact, or an explicit deadline chase before the filing window expires entirely.
Industry data shows that 86% of LTL shippers faced damage claims in 2022, yet carriers covered only 66% of costs — revealing a fundamental gap between claims filed and actual recovery that most enterprises don't even measure.
The Two-Clock Problem: Why Filing Speed Doesn't Matter
Most people assume faster filing means better outcomes.
The data shows the opposite.
Claims filed within the first 7 days of shipment succeed at only 29.8%. Claims filed between 8 and 45 days succeed at 71–78%. That's a 40-point gap.
The mechanism is that loss claims require the carrier to have failed at delivery, not just to be in transit.
Carriers have an internal process: the package has to miss its expected delivery date, a trace has to be initiated, the trace has to be inconclusive before the carrier will treat a shipment as genuinely lost.
Filing a claim before that process has run its course means you're filing against a shipment the carrier hasn't confirmed as missing yet.
When you measure filing lag not from ship date but from expected delivery date, the pattern sharpens:
- Claims filed on or before expected delivery: 16% success rate
- Claims filed 1–3 days after expected delivery: 34%
- Claims filed 8–14 days after expected: 74%
- Claims filed 15–30 days after: 76%
The inflection isn't at "file immediately" versus "file slowly." It's at "file before the carrier has completed its trace" versus "file after the carrier has exhausted its ability to find the package."
The filing deadline is the outer boundary — you have to beat it. But the carrier's trace window is the inner constraint — you have to wait for it.
The optimal window is neither earliest-possible nor last-minute. It's after the carrier has exhausted its search, while still well within the filing deadline.
This is precisely why an automated system outperforms human judgment on timing. A human trying to "file fast" will systematically file too early on some portion of claims and take the 29% success rate hit.
A system that monitors carrier scan events and waits for the trace window to close before filing captures the 74–76% success rate band consistently.
What Follow-Through Infrastructure Actually Looks Like
Follow-through infrastructure is a detection layer that watches every shipment, a filing layer that submits claims automatically, a status monitoring layer that polls carrier systems on a regular cadence, and a resolution layer that records outcomes and flags anything requiring human action.
The attempts field is the heartbeat of that monitoring loop.
1.7 average attempts on paid claims means the system filed, checked once, got a payment status, and closed. 4.2 attempts on denied claims means it filed, checked, saw a pending status, checked again, saw a denial, and recorded it.
It's not a fully autonomous system for every scenario. The 1.7% of claims requiring human action is real. For a company filing 4,400 loss claims per year — the large-shipper average — that's roughly 75 claims per year that need a human to submit a document or make a phone call.
That's manageable.
What it's replacing is the alternative: 4,400 claims per year that a human would need to file, monitor, and chase, where the unresolved rate without automation is 14–41% depending on the account.
The infrastructure reduces the human workload by roughly 98%, routes the remaining 2% to the right people with the right context, and produces a 71% success rate on everything it touches.
Before automation, teams had to monitor for loss, track until eligible for claim, submit within the window, gather required documentation, look up required details, follow through approvals, and manage exceptions.
Now, they only have to manage exceptions.
The 4-Phase Implementation Timeline
The implementation sequence matters because data connectivity has to come before process optimization.
If you optimize the claims process without first solving data connectivity, the first thing that breaks is timing precision.
The two-clock framework — file after the carrier's trace window closes, not just before the deadline — requires knowing when the shipment was supposed to arrive. Without a ship date, the system is filing blind into timing space.
Claims with no ship date have a 30% success rate, identical to claims filed too early. Claims in the optimal 8–45 day window have a 58% success rate. That 28-point gap is entirely a connectivity problem.
You can add all the automation, all the follow-through logic, all the resubmission rules you want, and none of it closes that gap if the system doesn't know when the shipment was supposed to arrive.
Phase 1: Data Connectivity (Months 1-2)
Connect shipment data sources to the claims platform. The minimum viable fields for large shippers are transportation value on every claim, recipient name on every shipment label for FedEx volume, and a substantive merchandise description on every claim record.
Everything else is either already handled by the platform or not materially affecting outcomes in this population.
36% of pre-ShipScience claims in our data have no shipment record at all. Those are claims someone filed manually, from memory or from a customer complaint, with no systematic connection to the shipment data.
The detection rate for a manual, connectivity-free process is roughly 2.3 claims per 1,000 shipments. A connected system files 3.0–3.5 per 1,000. That 30–50% detection gap isn't a process failure — the process worked fine on the claims it saw. It never saw the other third.
Phase 2: Detection Layer (Months 2-3)
Build the monitoring system that watches every shipment for loss indicators. This is where the system starts filing claims at the optimal timing window rather than waiting for customer complaints.
Across 226 accounts with comparable before/after data, 74% saw loss claim volume increase after onboarding, with a median increase of 108% and an average of 154%.
The accounts that saw volume decline were already sophisticated filers — they came in with an existing claims operation and ShipScience rationalized their process rather than replacing a gap.
Phase 3: Follow-Through Automation (Months 3-6)
Deploy the status monitoring and resolution logic. This is where the system starts checking carrier responses, routing exceptions, and closing the loop on paid claims.
84% of paid claims resolve within 14 days of filing. Median paid claim resolves in 4 days. Unresolved claims average 326 days without a system action.
The value isn't speed — it's precision about when to file and what to do when the carrier goes silent.
Phase 4: Performance Measurement (Months 6-12)
Shift from measuring claims filed to measuring claims paid. Track unresolved rate, average payout, and recovery as a percentage of shipping spend.
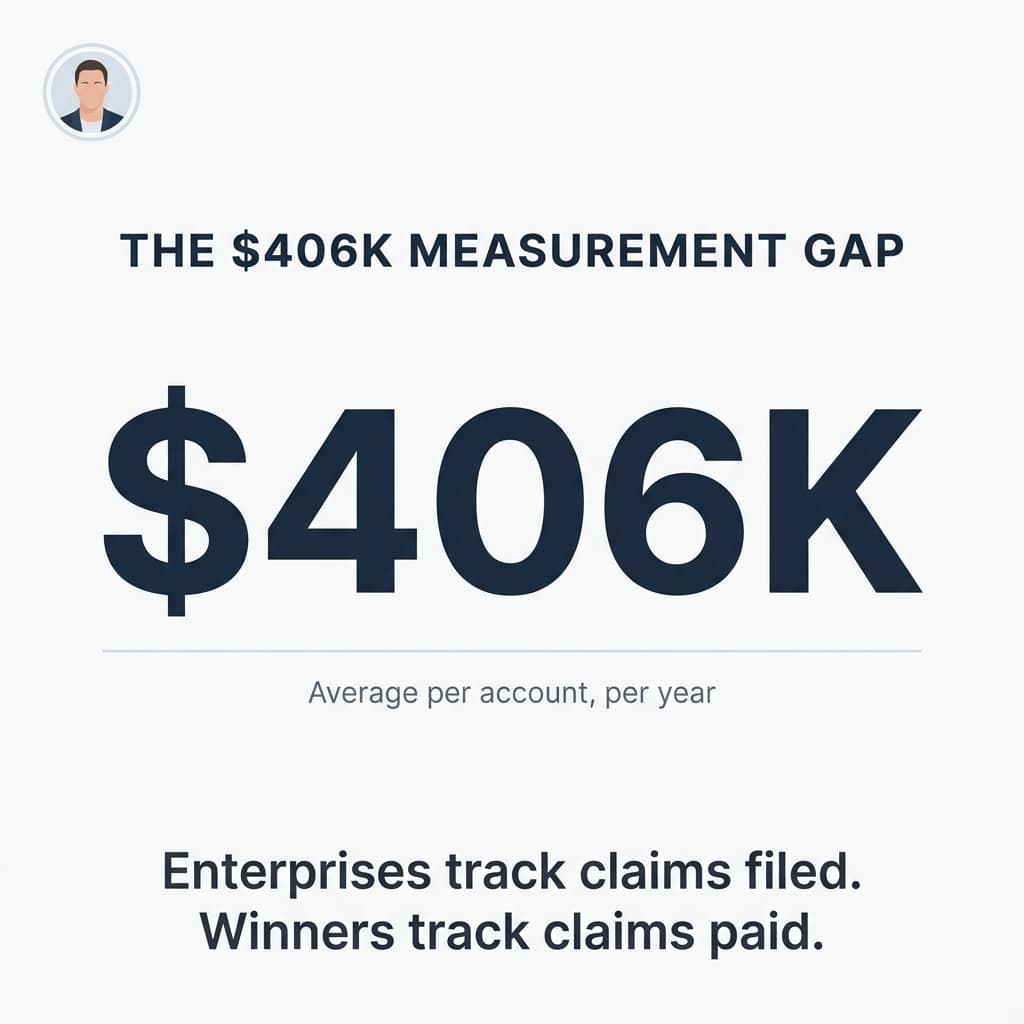
The before/after data for 14 large-shipper accounts shows average recovery per account of $171K before ShipScience and $577K after — a $406K per account incremental, running at roughly $27K per month.
That $406K started within the first three months and has been consistent for 15 months across 14 accounts.
How to Present This to Finance
The CFO argument has four moves, in order.
Move 1: Establish what's actually happening on the P&L right now.
When a shipper files a claim and a carrier pays $112, that money doesn't reduce a freight expense. It arrives as a carrier credit, typically applied to the account receivable or recognized as other income.
It didn't prevent a cost — the shipment cost what it cost. This is cash coming in that wasn't coming in before.
The distinction matters because cost reduction has a ceiling, but a revenue line has a budget, a forecast, and a variance report.
Move 2: Show the number as a recurring line.
Across 14 large-shipper accounts on ShipScience in 2025, monthly claim recovery has been positive in 99% of account-months. The floor month across the network was $137K, the ceiling was $805K.
Per account, the median monthly run rate is $23,900, annualizing to $287K. The coefficient of variation is 0.65 — there's variability, but it's the variability of a real revenue line, not the unpredictability of a one-time recovery.
A CFO can put $250K–$350K per account per year in the budget with reasonable confidence, flag months above $500K as upside, and treat anything below $100K as a signal to investigate data quality or filing cadence.
Move 3: Size it relative to shipping spend.
Claim recovery averages 0.76–0.95% of shipping spend. For a company spending $30M per year on freight, that's $230K to $285K per year in claim recovery.
That's a line item that belongs in the annual budget conversation alongside freight rate negotiations, carrier contract renewals, and surcharge audits.
Those other levers get dedicated headcount and executive attention. This one has historically been managed as an afterthought, which is exactly why 37% of the eligible pool is still going uncaptured.
Move 4: Make the incremental argument explicit.
The before/after data shows average recovery per account of $171K before a systematic process existed and $577K after. The delta is $406K per year, it started within the first three months, and it has been consistent for 15 months across 14 accounts.
That's not a projection. It's a mean and a median from a defined population, with a floor and a trend.
Why This Matters Now
Carrier rate increases have been relentless. FedEx and UPS parcel rates are now 38.9% higher than they were in 2018, with both carriers announcing an average rate increase of 5.9% across services in 2025.
Shippers saw their overall spend increase in the range of 7% to 9% in 2025 compared to 2024, with carriers making frequent changes to fuel tables to maintain higher surcharge percentages.
When shipping costs are climbing 7-9% annually, a revenue line that represents 0.76-0.95% of freight spend becomes material.
The question isn't whether to measure claims recovery. The question is whether you're measuring it as revenue or letting it disappear into cost accounting where finance can't track it.
Research confirms that 69% of companies report incomplete visibility into their supply chains, leaving them exposed to operational and financial risk. Organizations with strong visibility can capture 3-7% more market share by consistently delivering when others can't.
The enterprises that treat claims as a revenue line have a budget, a forecast, and a variance report. The ones that don't are leaving $406K per year on the table and calling it a cost center.
What are you measuring?


